The New Streaming TV Paradigm in 2026
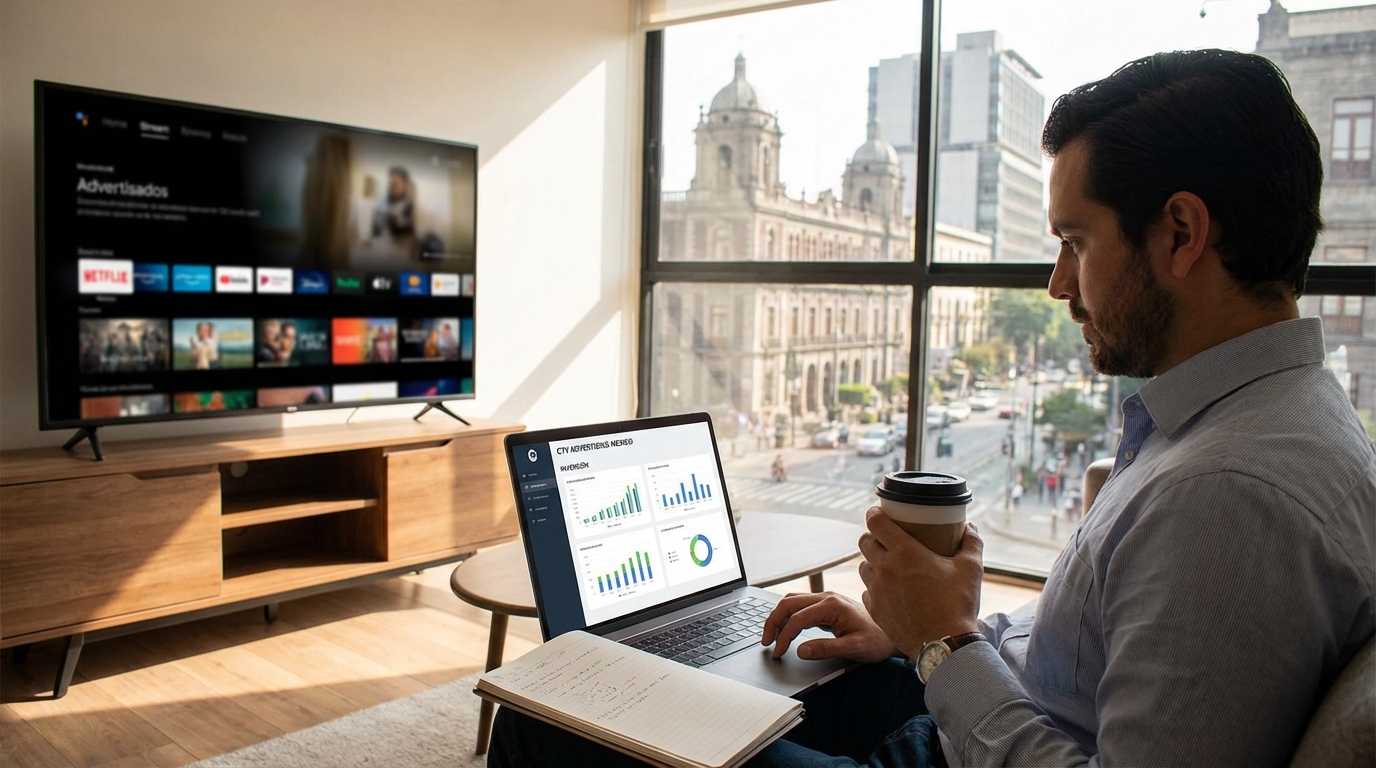
Just three years ago, talking about Connected TV advertising for an SMB sounded almost absurd. Costs were prohibitive, metrics arrived weeks later, and you needed an army of intermediaries to place a single 15-second ad. Today, that reality has completely changed. Real-time metrics have transformed the way small and medium-sized businesses manage their streaming TV campaigns, giving them a level of control previously reserved for large corporations with million-dollar budgets.
The Mexican advertising landscape is undergoing a quiet but powerful transformation. While traditional broadcasters struggle to hold onto fragmented audiences, streaming platforms are capturing more and more attention from consumers who prefer to watch content when they want, where they want. For your SMB, this represents a unique opportunity: reaching those audiences with flexible budgets and, most importantly, with data that allows you to adjust your strategy on the fly.
The fundamental difference between the old model and the current one lies precisely in that capacity for immediate response. You no longer have to wait for monthly reports to know if your investment is working. You can see it as it happens, make informed decisions, and optimize every dollar spent. Self-service platforms like Masha have democratized this access, allowing businesses with budgets starting at $0.01 per view to compete on the same screens as multinational brands.
The Evolution of Connected TV (CTV)
Connected TV has moved beyond an emerging trend to become the dominant channel for audiovisual consumption in Mexico. Mexican households are adopting streaming devices at an accelerated rate, and projections for 2026 show that more than 70% of active televisions will have an internet connection. This shift is not just technological: it represents a complete transformation in how audiences interact with content and, consequently, with advertising.
What distinguishes CTV from traditional linear television is the two-way flow of information. When someone sees your ad on broadcast television, you have no way of knowing if they watched it to the end, if they changed the channel, or if they were even in the room. In CTV, every impression generates data: watch time, interactions, device used, time of day, and geographic location. This wealth of information allows for targeting and optimization that are impossible in traditional media.
Platforms like Pluto TV and Roku have consolidated massive audiences in Mexico, offering accessible advertising inventory for businesses of all sizes. The key is to understand that you are no longer competing for limited slots during prime time: you are competing for the attention of specific audiences that you can identify and reach with surgical precision.
Why zero latency is the current standard
In the context of advertising metrics, latency refers to the time elapsed between an event occurring and when you can see it reflected in your reports. For years, the industry accepted latencies of days or weeks as normal. Today, any delay longer than a few minutes is considered unacceptable for optimized campaigns.
The zero-latency standard is not a technological whim; it has direct implications for your ability to react. Imagine launching a promotional campaign for a specific weekend. With delayed metrics, you might discover on Monday that your targeting was misconfigured and you wasted your entire budget. With real-time data, you detect the problem within the first few hours and correct it before the damage is significant.
Modern platforms process thousands of events per second and translate them into constantly updated dashboards. This technical capability requires robust infrastructure, but the benefit to the advertiser is undeniable: total control over every stage of the campaign, from launch to continuous optimization.
Critical Technical Quality of Experience (QoE) Metrics
The quality of the user experience directly determines the effectiveness of your advertising message. A brilliant ad loses all its impact if it plays with interruptions, low resolution, or excessive loading times. Understanding the technical metrics that affect this experience allows you to identify problems before they ruin your campaign.
The concept of QoE encompasses all the technical factors that influence how a user perceives content. It is not enough for your ad to be delivered; it needs to be delivered under optimal conditions. Streaming platforms constantly monitor these indicators, and you should do the same with your campaigns.
Video start time and re-buffering rate
Video start time measures how many seconds elapse from the moment a user should see your ad until playback actually begins. Behavioral studies show that every additional second of waiting increases the probability of abandonment by approximately 6%. For a 15-second ad, a three-second wait can mean losing a fifth of your audience before they see a single frame.
The re-buffering rate indicates how often playback is interrupted to load more content. Nothing destroys a viewer's attention faster than those frustrating pauses where the screen freezes. Although this factor depends partly on the user's connection, well-optimized platforms minimize these events through pre-loading techniques and geographically distributed servers.
Monitoring these indicators allows you to identify if certain audience segments are experiencing consistent technical issues. Perhaps your ads work perfectly in urban areas but struggle in zones with less developed internet infrastructure. With this information, you can adjust your targeting strategy or work with the platform to resolve technical issues.
Real-time adaptive resolution quality
Modern streaming systems use adaptive bitrate technology, which automatically adjusts video quality based on the user's network conditions. Your 4K ad might play in 720p or even lower if the connection cannot support higher quality. This ensures continuous playback, but it affects your brand perception.
Resolution metrics show you the quality at which your content is actually delivered. If you invest in high-quality production but most of your impressions are delivered in low resolution, there is a mismatch you need to resolve. It may mean your target audience has connectivity limitations, or that the platform is not optimizing delivery correctly.
Resolution also impacts the legibility of elements like logos, text overlays, and calls to action. A phone number or URL that looks perfect in 1080p can become illegible at 480p. Reviewing these metrics helps you make informed decisions about your ad creative design.
Engagement and User Behavior Indicators
Beyond technical metrics, you need to understand how users interact with your content. Engagement measures the level of attention and response your advertising generates, and it is the closest indicator to predicting actual conversions. An impression that no one sees is worth nothing, no matter how much you paid for it.
Attention heatmaps in live broadcasts
Attention heatmaps visually represent the moments during your ad when users maintain the highest concentration. This technology analyzes aggregated viewing patterns to identify the most effective seconds of your creative. Discovering that attention drops dramatically after the 8th second tells you that you need to restructure your message.
In live broadcasts, these maps gain additional relevance because the context is constantly changing. An ad during a high-tension moment in a sports match will have different attention patterns than the same ad during a quiet break. Understanding these variations allows you to better choose your placements and adjust your creatives for different contexts.
Advanced platforms allow you to segment these analyses by demographics, device, and time of day. Perhaps your ad performs excellently with audiences aged 25 to 34 but loses attention quickly with those over 50. This information is pure gold for optimizing both your targeting and your messaging.
Drop-off rate and predictive churn
The drop-off rate measures what percentage of users stop watching your ad before it ends. A 40% drop-off on a 30-second ad means that nearly half of your audience never saw your final call to action. Identifying this problem allows you to experiment with shorter formats or restructure your message to deliver the core value earlier.
Predictive churn uses algorithms to anticipate which users are most likely to drop off based on historical patterns. This capability allows you to dynamically adjust the frequency and type of ads shown to different segments. If a user shows signs of ad fatigue, reducing their exposure can preserve the long-term relationship.
These metrics are particularly valuable for retargeting campaigns. Bombarding someone with the same ad repeatedly not only wastes budget: it generates active resentment toward your brand. Drop-off and churn indicators help you find the balance between effective frequency and counterproductive saturation.
Smart Monetization and Dynamic Advertising
Streaming TV advertising offers personalization and measurement capabilities that completely transform the monetization model. It is no longer about buying fixed slots and hoping for results: you can optimize every impression based on concrete data and adjust your investment in real time.
Server-Side Ad Insertion (SSAI)
SSAI technology revolutionized streaming ad delivery by integrating ads directly into the video stream before it reaches the user's device. This eliminates ad-blocking issues, reduces technical interruptions, and provides a smoother experience for the viewer.
From an advertiser's perspective, SSAI offers greater delivery reliability and more accurate metrics. When your ad is inserted on the server side, you have certainty that it was actually included in the stream the user received. Traditional client-side insertion systems had significant failure rates that artificially inflated impression reports.
The technology also allows for dynamic personalization of ad content. The same slot can show different ads to different users based on their profile, location, or previous behavior. This capability multiplies the relevance of each impression and significantly improves response rates.
Immediate attribution in FAST and AVOD models
FAST channels and AVOD platforms represent the fastest-growing segment in streaming advertising. These free, ad-supported models attract massive audiences that were previously out of reach for SMEs. The key to leveraging them lies in attribution: connecting ad impressions with concrete user actions.
Immediate attribution closes the loop between watching an ad and taking action. Through techniques like unique promo codes, custom URLs, or integration with point-of-sale systems, you can track exactly how many sales or leads each campaign generates. This visibility transforms advertising from an expense into a measurable investment.
Multi-touch attribution models recognize that a purchase decision rarely happens after a single exposure. A user might see your streaming ad, search for you on Google days later, and finally buy after receiving a promotional email. Advanced platforms assign proportional credit to each touchpoint, giving you a realistic picture of each channel's value.
Artificial Intelligence Tools for Data Analysis
The amount of data generated by a streaming TV campaign exceeds the manual analysis capacity of any human team. This is where artificial intelligence becomes indispensable: processing millions of events to extract actionable patterns and specific recommendations.
Report automation with deep learning
Deep learning systems analyze your historical data to identify correlations that would go unnoticed in traditional analyses. They might discover that your conversions increase by 23% when your ads are shown between 9 and 11 p.m. on Tuesdays, but only for users in mid-sized cities. This level of granularity would be impossible to detect manually.
Report automation frees up valuable time that you can dedicate to strategy instead of data compilation. Instead of spending hours extracting numbers from different sources and putting together presentations, you receive automatically updated dashboards with the metrics that truly matter to your business.
The most advanced systems don't just report what happened: they predict what will happen. Using predictive models, they can estimate the expected performance of different campaign configurations before you spend a single peso. This simulation capability dramatically reduces the risk of experimentation and accelerates the optimization process.
Strategies to Optimize Your Streaming Channel
Knowing the metrics is just the first step. The real value lies in translating that data into concrete actions that improve your campaign performance. Here are proven strategies that work for Mexican SMEs in today's streaming TV ecosystem.
Set alert thresholds for critical metrics. You can't be checking dashboards constantly, but you can set up automatic notifications for when something falls outside the norm. If your abandonment rate exceeds 50% or your cost per view spikes, you need to know immediately to investigate and correct it.
Experiment systematically with different variables. Change one thing at a time: creative, targeting, time of day, platform. Document every experiment and its results. Over time, you will build a deep understanding of what works specifically for your audience and your product.
Take advantage of the flexibility of self-service platforms. With no contracts or minimum investments, you can test risky ideas with small budgets before scaling them. This freedom to experiment is a competitive advantage that large companies with bureaucratic processes don't have.
Integrate your streaming data with other information sources. Connect your campaign metrics with your CRM, your sales system, and your web analytics. A complete view of the customer journey allows for optimizations that would be invisible if you analyzed each channel separately.
The opportunity for Mexican SMEs in streaming TV has never been more accessible. Platforms like Masha allow you to launch campaigns on major TV and music apps with just 10 clicks, starting at $0.01 per view, with live metrics that